People love infographics. They are a tremendous visual tool that helps information and data be presented and absorbed by viewers. Infographics are 3x more likely to be shared and liked over any other visual material according to MassPlanner. A carefully crafted, designed and illustrated infographic can promote a business and the products or services they offer or highlight information that is important to your customers.
Infographics are 3x more likely to be shared and liked over any other visual material
At Trillion, we have been infographic designers for many years. We design, plan and create infographics for our clients to use online, on websites, in social media, in annual reports, on posters and more! We have tested and refined our process for getting the most traction and visibility with them online (and in print). The process of creating an infographic can take some time. However, the effort pays off dramatically by getting your audience engaged with compelling visuals.
Below are four critical steps to get your infographic viewed by the most people.
Timing is Everything
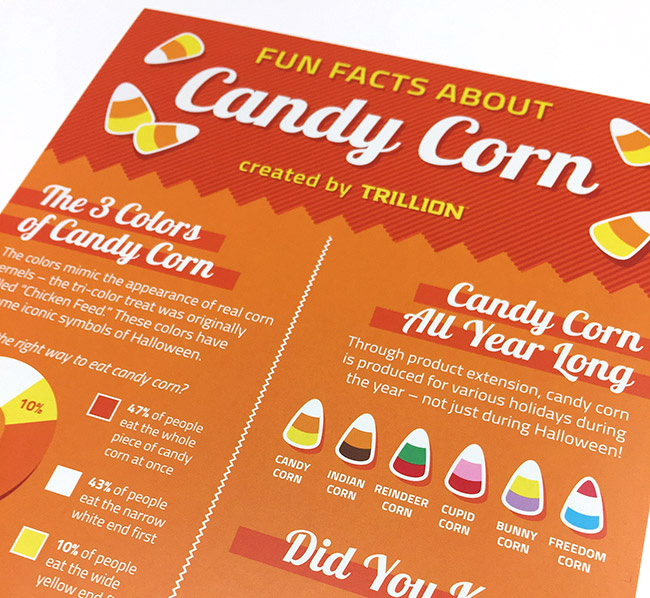
Timing is especially important for certain infographics. For example, last fall Trillion developed an infographic about the history of candy corn and chose to share it in late September-early October, way before Halloween. Even though candy corn is sold year round, the days leading up to Halloween is when interest is at its peak.
We researched and developed content in early September and developed our infographic before October. In early October we published our infographic online. We also mailed out a printed postcard with the infographic to our mailing list the week before Halloween. At the same time, we tweeted out key facts from the infographic during the week leading up to Halloween.

Our carefully planned distribution calendar allowed us to get the most traction for our infographic. The early publishing of the infographic on our website allowed media outlets to find and share it. Our submissions to websites that feature infographic design gave us greater exposure, and the additional creation of social media snippets allowed the content to be easily and quickly shared online.
Develop a Social Media Strategy for Your Infographic
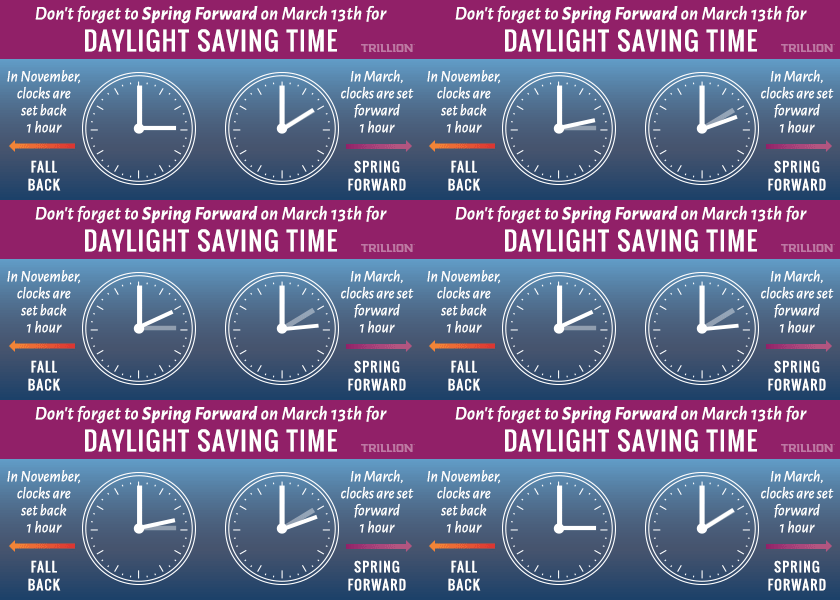
Before releasing our daylight saving time infographic design, Trillion identified organizations and groups that may be interested in our creation. This includes any data sources we used to create the infographic, organizations that could benefit from sharing this information (such as the American Red Cross—check your smoke detectors) as well as press and media contacts that may publish our content (trade organizations, traditional media outlets and bloggers).
Prior to releasing the infographic, we follow all of these organizations online and make sure they are aware of our infographic. Using hashtags was especially important. The #dst hashtag allowed us to show up in feeds of organizations interested in energy savings and day light savings time. Tweeting out smaller sections of the infographic sized for twitter with other relevant organizations facilitated retweets by those organizations. This process helped the infographic be seen by many more people—those that we would not have otherwise had access to.
Infographic Submission
Leveraging the followers and web traffic of other websites is critical in gaining exposure to new people. We identified and submitted our infographic designs to websites that specialize in publishing and discussing them. Some of these websites implement a pay-to-play model and others were free. Depending on the topic of your infographic, you will be able to submit it to industry and topic specific media outlets—gaining new and more exposure for your infographic.
Leveraging the followers and web traffic of other websites is critical in gaining exposure to new people.
Repurpose Your Infographic and Use it to Your Advantage
Position your new infographic for success by sharing it across all of your marketing channels. We created a direct mail piece, smaller, sharable social media snippets, an educational blog article and an email newsletter topic from our infographic, not to mention this blog post! Repurposing your infographic across many channels will allow you to have a greater reach.

Leverage Your Website’s Metadata
Metadata helps describe the data and content of your web page to search engines and more. The title of your infographic, your byline, your web page title, and your URL can all effect how searchable and visible your infographic is online. Here are some general rules of thumb;
- Include the title/theme of the infographic
- Include the word infographic along with your organizations name in the file name. Ex: daylight-saving-time-infographic-trillion.jpg
- Use descriptive, keyword-rich meta descriptions (think about what a user would be typing into search engines to find your infographic)
- Include a descriptive alt description for the image on your website using keywords for your organization: Ex: daylight savings time infographic design by Trillion, an award winning infographic designer.
- Include your byline in the title. As publications share your content, not everyone will necessarily share your URL, make sure you get the credit you deserve for the creation of your infographic by incorporating your organization’s name (at the very least) into your infographic.
Getting Started with Infographics?
If your organization is looking for increased visibility online, consider developing a strategically shareable infographic. If you need help, call us 908.219.4703 or fill out our contact form.


