 The Tech Interactive End of Year Appeal




An annual report represents a significant investment of time, money, and organizational energy. Your team gathers the information, interviews staff and beneficiaries, collects photography, organizes financial data, develops the design, and often prints and mails the finished piece.
But will anyone actually read it?
We live in the age of the skim. Donors, supporters, volunteers, and potential funders are consuming information on their phones, jumping between emails, websites, social media, and newsletters. Even when people care deeply about your mission, their attention is limited.
Why Annual Report Design Matters for Nonprofits
A thoughtfully designed nonprofit annual report can be one of your strongest donor communications tools. It can capture attention, demonstrate measurable impact, build trust, and remind supporters why their involvement matters.
Successful annual report design transforms information into a narrative that people can understand quickly and remember. The key is to present your story the way people consume information today.
What Donors Skip and What They Actually Read
Most readers scan the page first and then decide what to read.
What Readers Tend to Skip
- Large blocks of uninterrupted text
- Long, generic leadership letters
- Dense paragraphs without visual breaks
- Pages filled with line-item financial tables
- Statistics without context
- Long lists of names without visual variation
What Makes Readers Stop and Look
People are naturally drawn to content that gives them an immediate reason to pay attention.
- Short, compelling quotes
- Strong headlines and subheads
- High-quality, candid photography
- Easy-to-understand data graphics
- Large impact statistics
- Short captions that add context
- Donor and volunteer stories
- Clear connections between contributions and outcomes
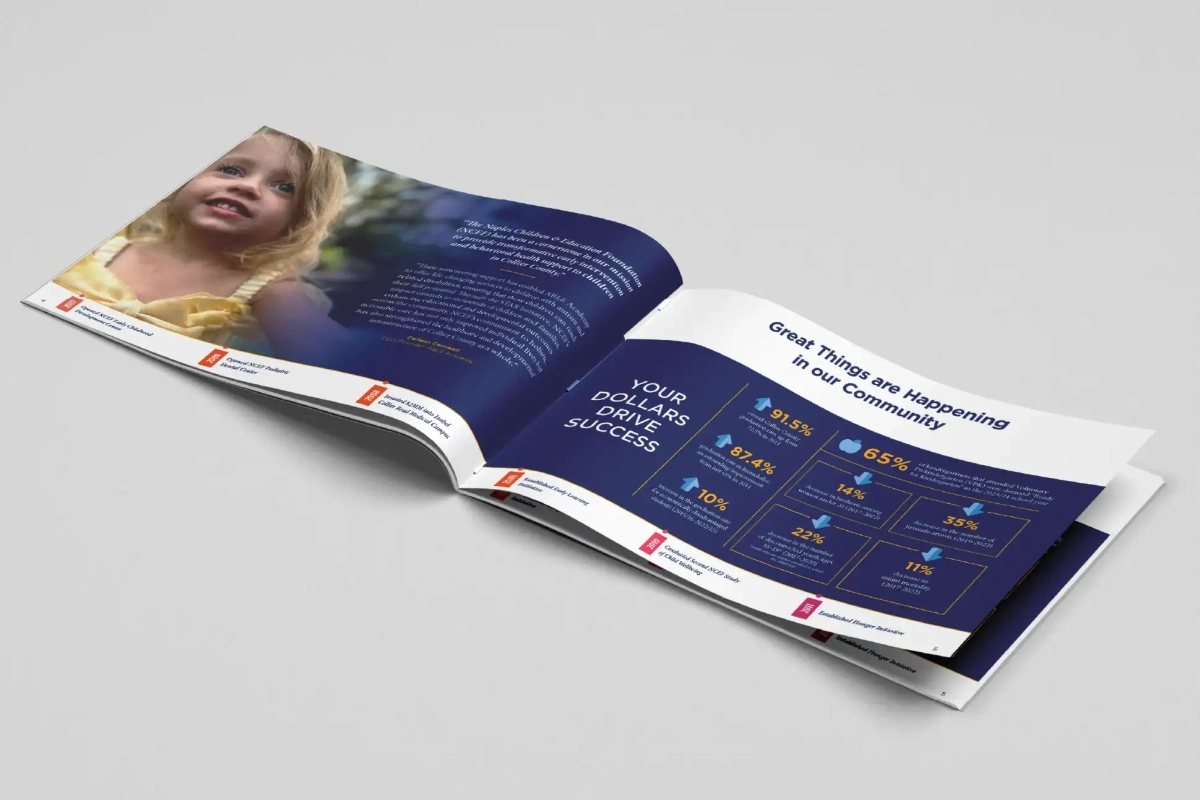
How to Structure an Engaging Nonprofit Annual Report
A successful annual report has a form, but it doesn’t necessarily have to be chronological. Instead of organizing the report as a calendar list of everything that happened during the year, build it around the stories and outcomes that best demonstrate your organization’s impact.
Humanizing Your Nonprofit Annual Report
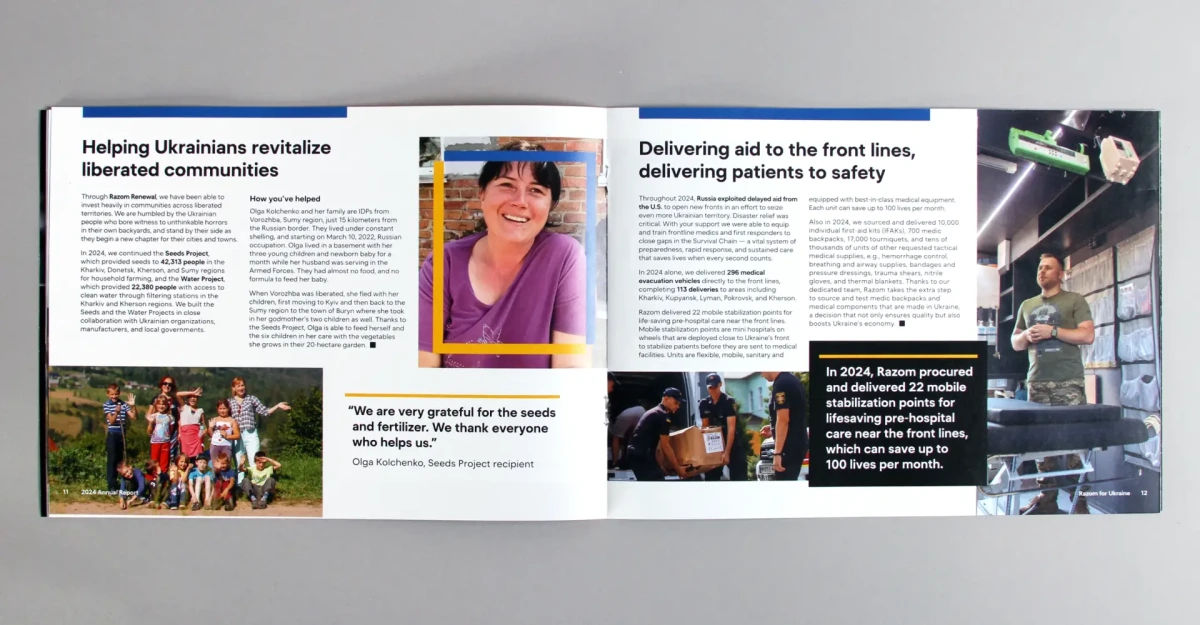
Lead with stories of people: people you have helped, community voices, volunteer experiences, or donor stories that give your report personality and emotional depth. Use photography and first-person quotes whenever possible. A short, authentic quote can communicate something that several paragraphs of institutional language cannot. The goal is to create an emotional connection between the reader and the tangible way your organization is making a difference.
Turn Donor Recognition Into Part of the Story
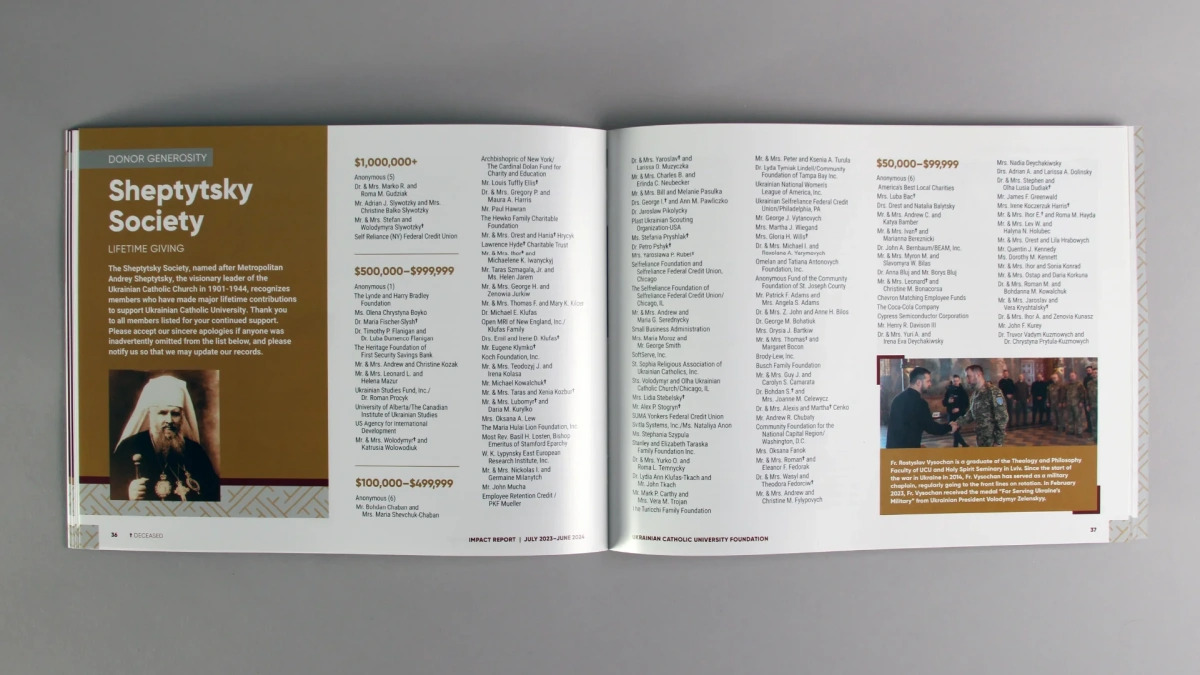
You want to list your donors, but several pages of names can quickly become visually monotonous. To breathe life into these pages, integrate other information to break up the lists.
- A short impact story
- A photograph and caption
- A quote from a donor
- A quote from someone your organization helped
- A milestone your supporters helped achieve
This helps remind donors that they are not simply funding the organization. They are part of the story.
Make Your Financial Data More Interesting
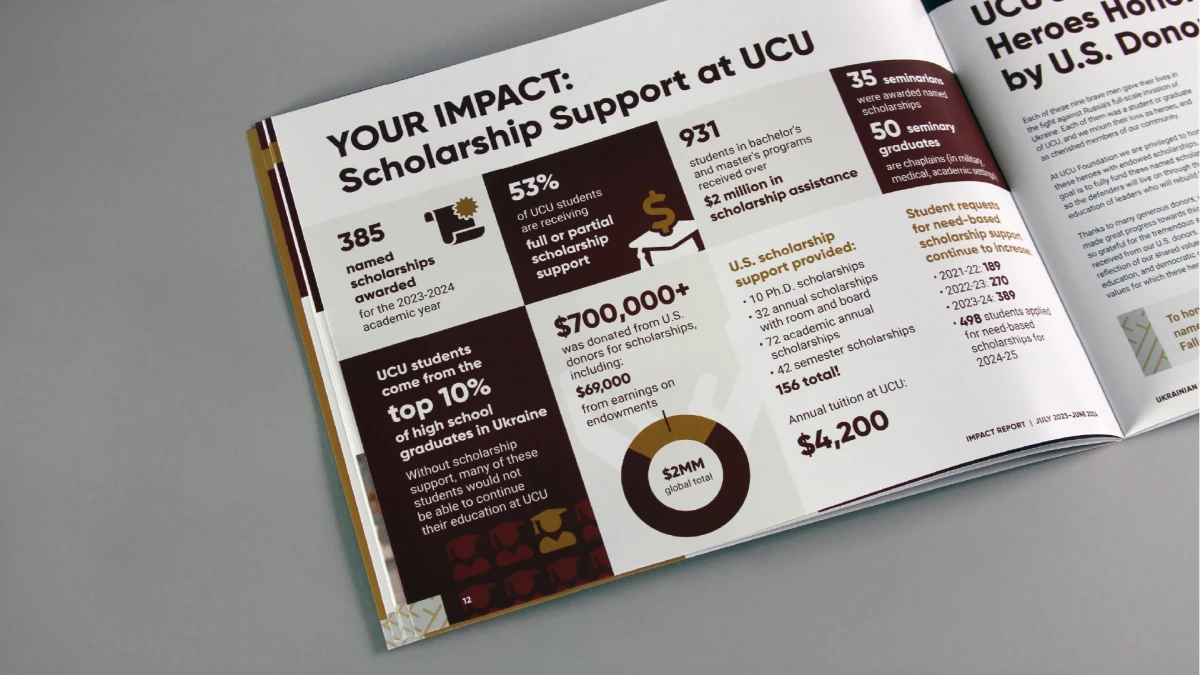
What do you want the reader to understand? Branded infographics, simple charts, callout statistics, and visual comparisons will make your data much easier to absorb and, even better, will show the reader how financial information translates to outcomes.
- Large numerical callouts
- Simple charts
- Visual comparisons
- Short explanations
- Program spending breakdowns
- Impact metrics
Where appropriate, connect dollars to outcomes. For example, $50 provides 10 meals, or $1,000 funds a month of after-school programming for 20 students.
Keep the Reader’s Eye Moving
Interspersing photographs, captions, quotes, infographics, donor recognition, volunteer profiles, and impact statistics gives readers multiple entry points into the content. Make sure that on any page a reader flips to, there is something that will capture their attention and invite them to keep turning the pages.
Print or Digital? Why Nonprofits Should Consider a Hybrid Annual Report
For many organizations, the question is no longer whether to print an annual report or publish it digitally. Because printing and mailing can be expensive, it makes sense to produce a small number of beautifully designed physical reports for major donors, board members, prospects, fundraising meetings, and other important stakeholders, and at the same time, to publish a digital version online and share it through email.
This hybrid approach gives supporters a choice in how they engage with your organization.
The Printed Annual Report: A Powerful Donor Leave-Behind
In an increasingly digital world, a high-quality printed annual report creates a memorable physical touchpoint. It can be a useful tool during:
- Major donor meetings
- Board recruitment
- Corporate sponsorship conversations
- Fundraising presentations
- Campaign meetings
- Community events
- Press and media outreach
It can also sit on a desk or coffee table, providing a lasting reminder of your organization’s work.
The Interactive Annual Report: A Better Digital Experience
A PDF is useful, but it shouldn’t necessarily be the end of your digital strategy.
PDFs can be cumbersome on mobile devices, difficult to navigate, and less discoverable than content published directly on your website. They also require readers to open or download a separate document before they can begin exploring your organization’s story.
An interactive annual report offers another option. It is a branded web experience that lives directly on your website.
Why Create an Interactive Web Annual Report?
- Built for mobile. A responsive web experience can adapt to smartphones, tablets, and desktop screens, making your annual report easier to read wherever your supporters are.
- Hosts video content. Video is an ideal way to tell stories and engage viewers. A web report lets you include brief, polished footage of events, beneficiary interviews, volunteer experiences, or behind-the-scenes moments that bring your organization’s impact to life.
- Brings data to life. Animated statistics, interactive charts, video, photography, and other digital elements can make your organization’s impact feel more immediate.
- Makes engagement measurable. Unlike a printed report, a web-based annual report can provide you with analytics that help your organization understand how visitors interact with the content, including which stories attract attention and how visitors move through the page.
- Makes donating easier. A web-based report can incorporate clear calls to action directly alongside impact stories. Instead of requiring a reader to leave a PDF, find your website, and locate the donation page, you can give them a direct path to take action.
- Improves discoverability. Because the content lives on your website, your annual report can become part of your organization’s broader online presence rather than existing only as a downloadable file.
Connect it with your printed report using a QR code. A donor can receive a beautifully printed annual report, scan the QR code, and immediately access the full interactive version online. That creates a seamless experience between the physical and digital worlds, and gives your supporters the ultimate choice in how they engage with your mission.
How Can Your Annual Report Build Stronger Donor Relationships?
Donors will see themselves as part of the organization’s success when their contributions are clearly connected to people, programs, outcomes, and change. That makes your annual report an important part of donor stewardship, not simply an annual obligation.
Frequently Asked Questions
Are printed annual reports still worth the money, or should we go completely digital?
A hybrid approach usually delivers the best return on investment. Printing a small run of high-quality physical reports gives your team a valuable tool to leave behind after major donor meetings, board pitches, and corporate sponsorship presentations. Pairing that with an interactive digital version on your website allows you to reach a broader audience, track real engagement metrics, and give every supporter a choice in how they connect with your mission.
What is the best way to make dense financial data look interesting to donors?
Skip the full, multi-page accounting tables and translate the numbers into visual stories. Use custom-branded infographics, pie charts, and large callout numbers to highlight where your funding comes from and where it goes. To make the data resonate on an emotional level, directly connect dollars to tangible outcomes, such as showing that every $50 raised provided 10 meals. This turns standard financial reporting into clear proof of impact.
Tell Your Year’s Story With Trillion
Trillion has a talented team of designers and writers who can take everything your organization accomplished during the year and transform it into a beautifully told story across both print and web. From compelling editorial design and powerful photography to clear infographics and engaging interactive experiences, we can help you turn your annual report into a donor communication tool that captures attention, communicates impact, and keeps supporters connected to your mission. Contact us at 908.219.4703 or use this form to turn your year of impact into a story your donors will want to read and remember.