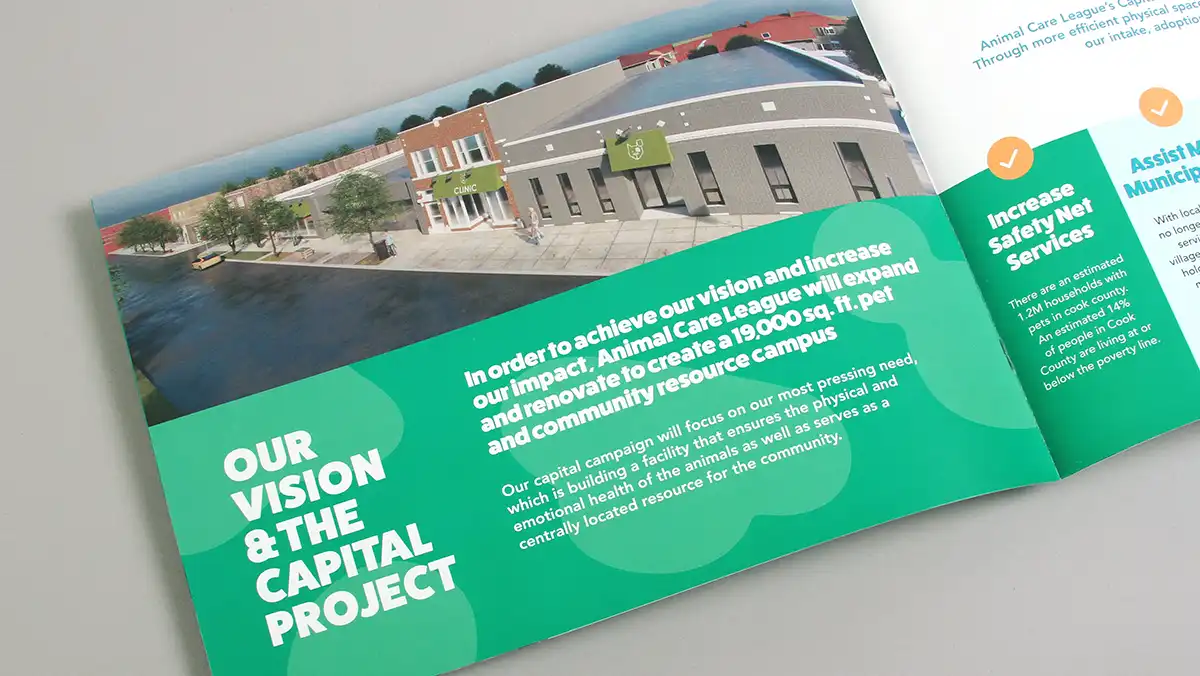
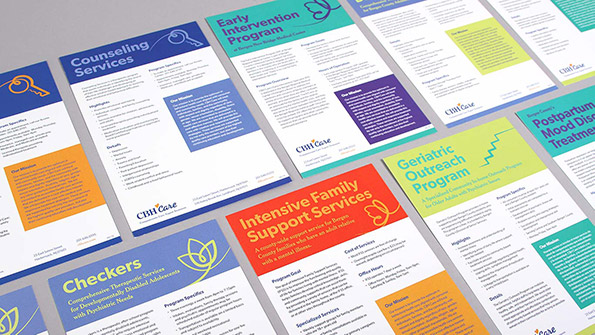
As an executive responsible for a brand, you most certainly have a clear idea of what you need to do to succeed and how to implement your plan. However, it may sometimes be a challenge to articulate these concepts to your customers beyond using standard charts and graphs. Explaining complex data or statistics in order to prove a point, show financial data, or convey a complicated business process to your customers can be difficult. For these types of scenarios, infographics are an excellent way to show and explain information in order to make it easier and more enjoyable for your audience to absorb your message.
What is an infographic?
Infographics (derived from the words “information” and “graphics”) are graphic representations of bits of information organized to tell a larger story. A well-conceived infographic combines visually engaging graphic design, compelling writing and data analysis into a highly effective communications piece.
Where can you use infographics?
Below are several examples of infographics that can draw readers in as well as encourage them to become more engaged with your story. Infographics can be used in their entirety or in small sections on websites, posters, flyers, social media and more in order to create multifaceted selling opportunities for brands.
Sales Proposals
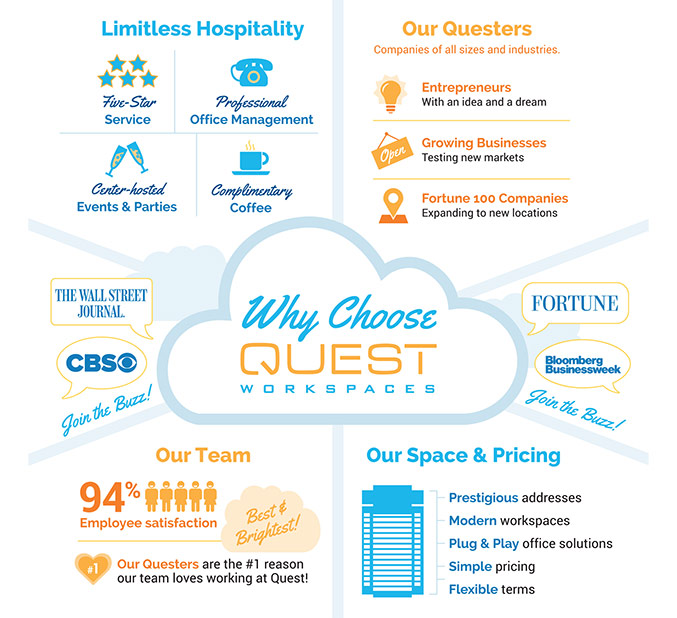
Infographics introduced into sales proposals can help your readers quickly digest the most important information about your business. We helped Quest Workspaces, a turn-key office provider with several locations in New York and Florida, develop an infographic that explains why clients choose Quest for their office space. Rather than trying to explain each benefit within paragraphs of text, we created a one-page infographic that could set their proposals apart from their competitors and explain why they are the best choice—a major competitive advantage for Quest.
Social Media Campaigns
If your organization has an active social media presence, you may consider introducing infographics as a part of your social media marketing campaigns. The most effective infographics shared via social media show small snippets of information – such as one key benefit or fact – in a visually stunning chart or graphic. Compelling and visually interesting infographics are much more likely to be shared (and can even go viral) instead of traditionally published facts and figures.
Annual Reports
An annual report is an ideal candidate for infographics. Introducing an infographic can help summarize key pieces of the report or visually highlight the achievements of the organization. It can be placed at the front of the document as a visual summary or be broken out into snippets of visually articulated data throughout the entire piece.
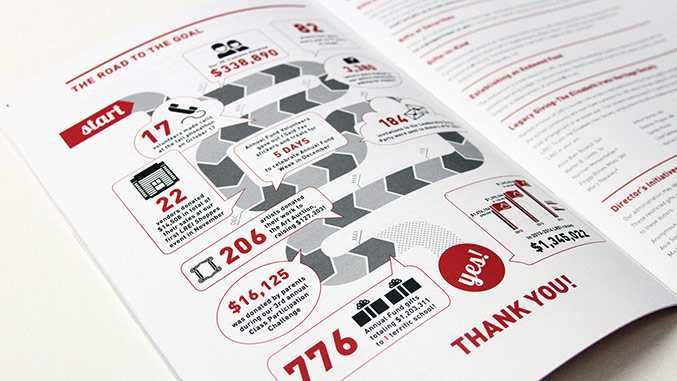
With Trillion’s help, The Little Red School House, a K-12 independent school in New York City, introduced an infographic to help engage community involvement in its annual fundraising campaign for the school. An infographic inspired by a board game highlighted the year’s activities that the annual fund committee participated in. It also helped drive the point home that the annual fund is a year-long, community-driven process which benefits the entire school in many ways.
Where to start with infographics?
If you find yourself with the need to explain complicated concepts or sets of data in a succinct way, consider an infographic. The first step in having an infographic created is identifying a concise goal or theme. Then, you can provide a graphic design team with the most salient points of data you’d like to highlight. From there the design team can develop a strategic layout that accurately depicts the data in a visually appealing way—aligning it with your brand and goals—and engages your audience.
If you are continually looking for new ways to provide clarity to your clients, prospects or constituents, introducing infographics into your marketing materials is another great tool which can lead to success. Once developed, infographics can be utilized across many different marketing channels providing new opportunities for you to share your ideas visually.
Call Trillion to help create your infographics
If you are looking for an award-winning graphic design agency to create stunningly effective infographics, look no further. Contact Trillion or just give us a call at 908.219.4703. We can discuss your storytelling challenge and how an infographic can help explain it more easily.


